The gui.charting Package
This package contains a simple chart-drawing library for GTK, which provides the following features:
- multiple graphs on a single chart
- graphs drawn as continuous lines (function graphs) or a series of points (point graphs)
- ticks and tick labels whose intervals are automatically chosen based on an axis’ length and maximum value
- dimension labels on the axes, which show the dimension of the values on that axis, optionally as a proper fraction
- secondary ordinates, which are shown on the right side of the charts and allow a single chart to show graphs using two different dimensions
- chart captions, which are omitted for charts without graphs
The package contains three modules: gui.charting.chart, gui.charting.axis, and gui.charting.graph.
A simple GUI using a Chart might be constructed as follows:
import gtk
from gui.charting.chart import Chart
from gui.charting.graph import FunctionGraph, PointGraph
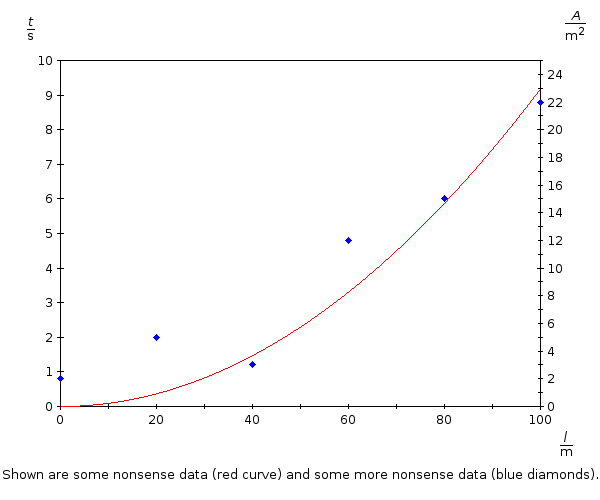
function = lambda l: (l / 33)**2
points = ((0, 2), (20, 5), (40, 3), (60, 12), (80, 15), (100, 22))
chart = Chart()
chart.minCaptionLines = 2
chart.showSecondaryOrdinate = True
chart.abscissa.maxValue = 100
chart.ordinate.maxValue = 10
chart.secondaryOrdinate.maxValue = 25
chart.abscissa.dimensionLabelText = '<i>l</i> / m'
chart.ordinate.dimensionLabelText = '<i>t</i> / s'
chart.secondaryOrdinate.dimensionLabelText = '<i>A</i> / m<sup>2</sup>'
chart.addGraph(FunctionGraph(function, 'red'))
chart.addSecondaryGraph(PointGraph(points, 'blue', style='diamonds'))
chart.captionText = (
'Shown are some nonsense data (red curve) '
'and some more nonsense data (blue diamonds).')
window = gtk.Window()
window.set_default_size(600, 500)
window.connect('destroy', lambda widget: gtk.main_quit())
window.add(chart)
window.show_all()
gtk.main()
The resulting chart looks like this: